Habit Tracker with PyGitGraph
I turned PyGitGraph into a habit tracker — using GitHub Issues to log habits and GraphQL to extract the data for analysis.
Habit Tracking Use Case
Most habit trackers are either paid or limited to mobile apps without cross-platform support. A significant drawback is the difficulty in extracting data for personal analysis. Questions like "How long did I fast on average this month?" or "What are my weight trends during the holidays?" are hard to answer due to the difficulty in exporting data.
PyGitGraph solves this. Simply open an issue when you start a habit and close it when you finish. Every few days, extract this information using PyGitGraph with just a click, and then create the graphs you like.
Habit Tracker Graphs
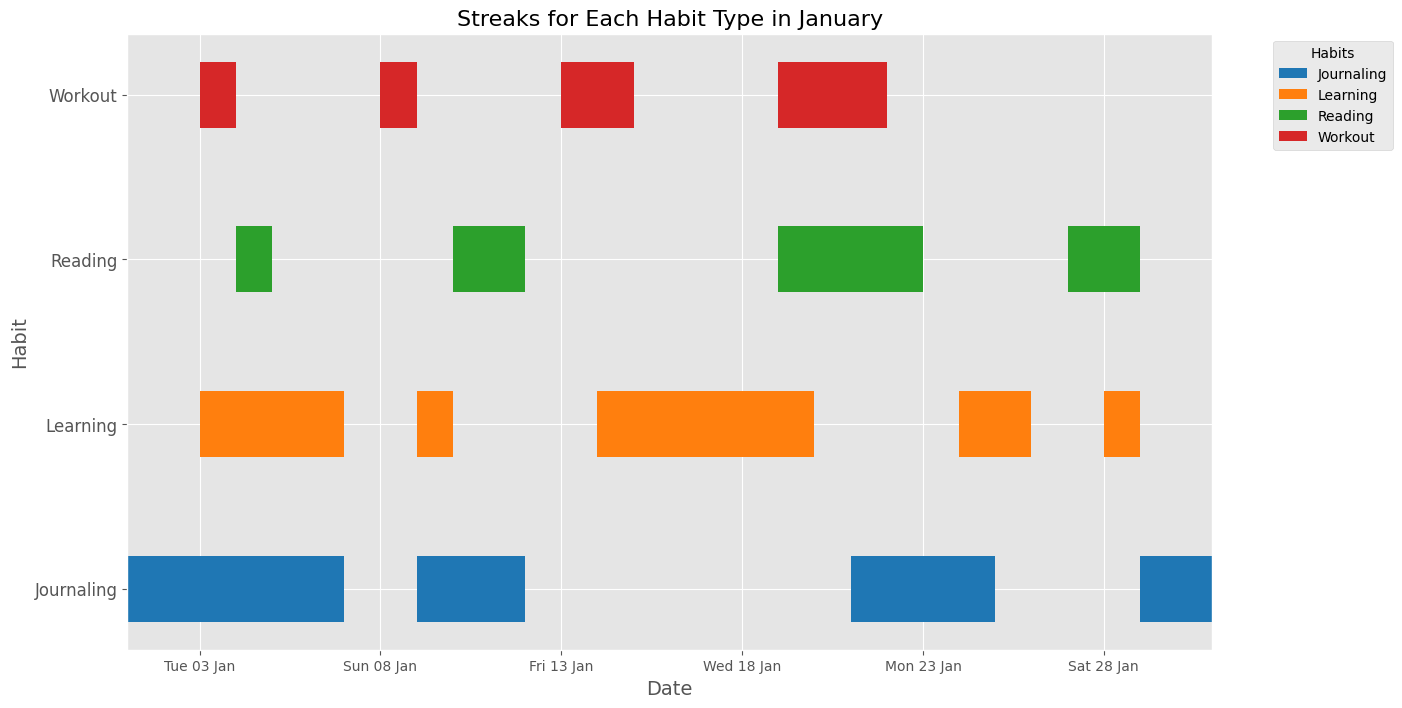
What was my streak for a particular habit?
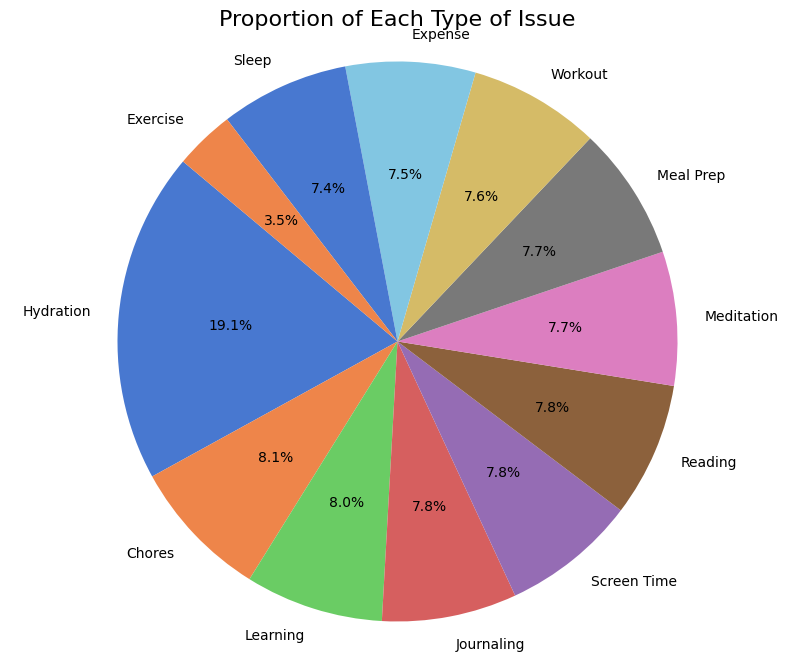
Out of the total habits that I tracked, what is the proportion of each habit type?
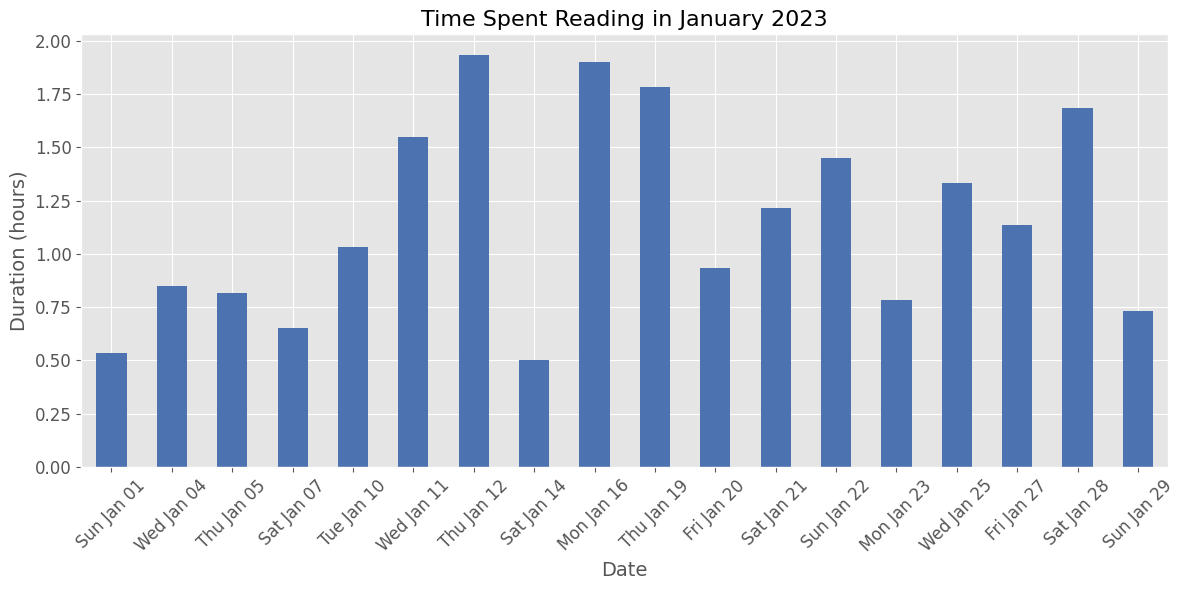
How long and how often do I read?
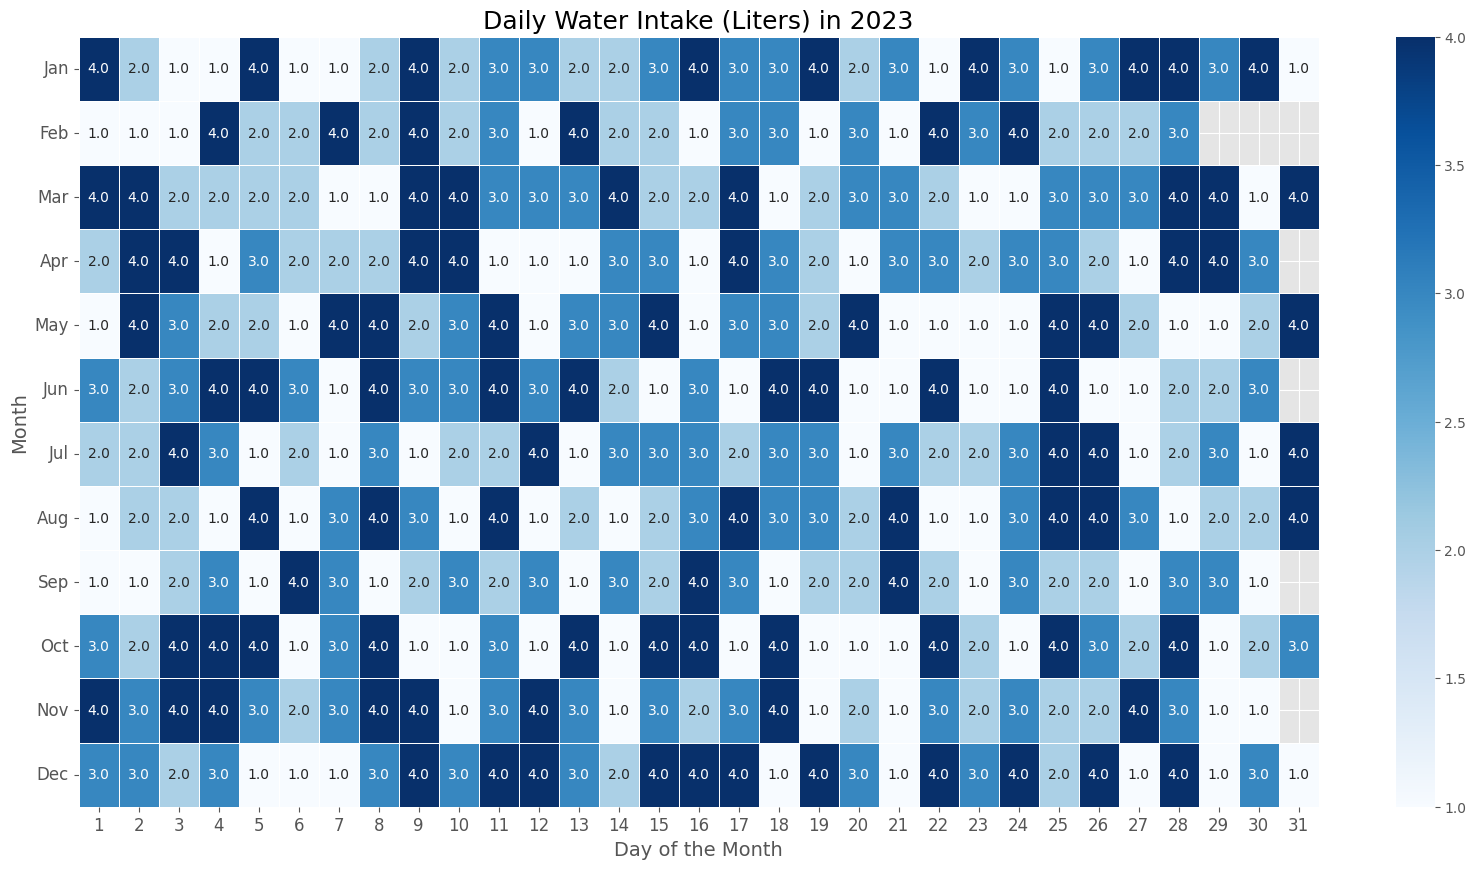
How many liters of water do I drink each day?
More Use Cases
GitHub Issues and PyGitGraph support many more use cases — see the full list here.
Have a use case in mind? Shoot me an email.
Want to improve the code? Fork it here.